LinkedIn analytics are the numbers that show how your posts, profile and outreach are doing: impressions, engagements, followers, profile views and, for outreach, acceptance and reply rates. They are only useful if you measure the same few numbers the same way every time and compare yourself with your own past results.
That last part trips people up. A single post’s numbers move around a lot, and a figure from someone else’s account tells you very little about yours. So this page is mostly a reference: what each number means, a worked example of reading two posts side by side, a table of what to change when a number is low, and a simple sheet for building your own baseline.
The numbers, in one table
| Metric | What it tells you | Where you find it |
|---|---|---|
| Impressions | How many times your post was shown in someone’s feed | Each post’s analytics |
| Engagements | Reactions, comments, reposts and clicks, added together | Each post’s analytics |
| Engagement rate by impressions | The share of people who saw the post and did something | Our calculator, from the two numbers above |
| Engagement rate by followers | Engagements compared with the size of your audience | Our calculator, using your follower count |
| Comments | Real conversation, worth watching on its own | Each post’s analytics |
| Followers | Whether your audience is growing over time | Your profile’s analytics area |
| Profile views and search appearances | How often people find you and click through | Your profile’s analytics area |
| Acceptance, reply and meeting rates | How well your outreach turns into conversations | Your own records, run through our calculator |
If you only track three things, track impressions, engagement rate by impressions, and comments. Our guide LinkedIn Impressions Explained covers what counts as one.
Reading two posts side by side
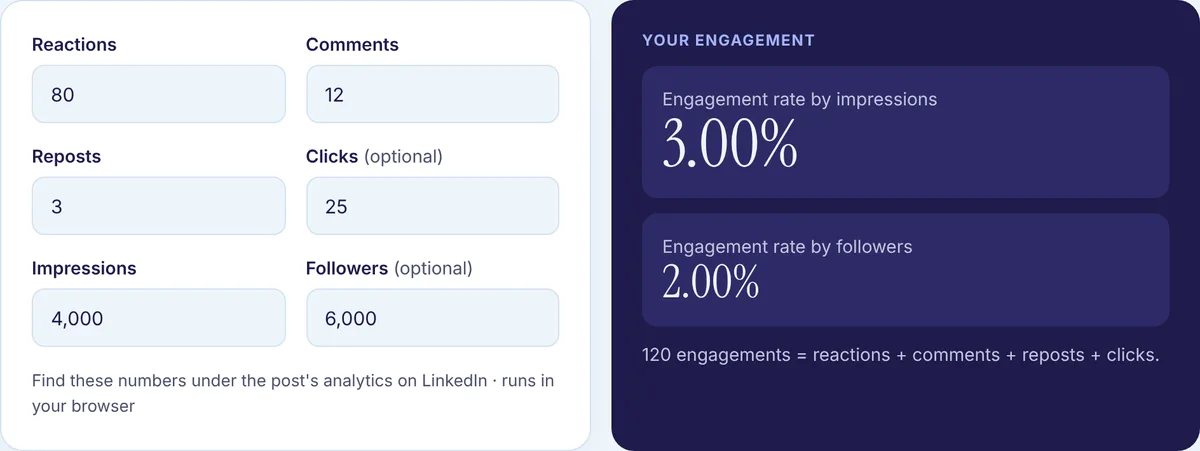
Here is a worked example with made-up numbers, run through the same formula our Engagement Rate Calculator uses. It adds reactions, comments, reposts and clicks, divides by impressions or followers, and rounds to two decimals. The account in this example has 1,850 followers.
| Post A | Post B | |
|---|---|---|
| Reactions | 61 | 40 |
| Comments | 9 | 14 |
| Reposts | 3 | 2 |
| Clicks | 15 | 6 |
| Engagements | 88 | 62 |
| Impressions | 2,400 | 900 |
| Rate by impressions | 3.67% | 6.89% |
| Rate by followers | 4.76% | 3.35% |
Which post did better? It depends on the question. Post A traveled further and had more total engagement, so by followers it looks stronger. Post B reached fewer people, but a much larger share of the people who saw it acted, and it drew more comments. That usually means the topic landed with the right readers, even if the feed did not push it far.
A sensible reading is: write more posts on Post B’s topic, and borrow what got Post A shown, maybe its hook or its posting time, to get that topic in front of more people. That is the kind of decision analytics are for. Neither number on its own would have told you.
When a number is low, what to try
Treat this as a list of first guesses, not rules. Change one thing, give it a few weeks, and check again.
| What you see | Likely cause | Try first |
|---|---|---|
| Low impressions across most posts | The opening line is not stopping people, or you post when your audience is offline | A different hook type, then a different posting window |
| Good impressions, low engagement rate | The post was shown to people it did not speak to | Narrow the topic and write for one reader |
| Reactions but almost no comments | Nothing in the post invites a reply | End with a question that takes one line to answer |
| Flat follower count | Posts are useful but people cannot tell what you post about | Stick to two to four topics and say so in your headline |
| Low connection acceptance | Wrong people, or a vague note | Tighter targeting and a note with one specific reason |
| Accepted, but few replies | The first message pitches too early | Ask an easy question about their work instead |
For the writing side of these fixes, see our content strategy guide. For the outreach side, our outreach guide walks through each message in a sequence.
Timing, and how to test it properly
Your audience is online at certain hours, and there is no single best time that suits everyone. Pick one window when your readers are likely at work, post in it consistently for a few weeks, and then compare with another window. If your readers live in other time zones, the Best Time to Post planner converts their hours into yours so you do not have to do the math every time.
Only test one variable per round. If you change the posting time and the hook style in the same weeks, you will not know which one moved the numbers.
Outreach numbers
For outreach, the funnel is short: requests sent and accepted, people messaged and replies, and meetings booked. The Acceptance and Reply Rate Calculator turns those into rates and shows how many requests one meeting takes. Use numbers from the same period, such as the last 30 days, so each rate compares like with like.
Build your own baseline
People often ask what a “good” engagement rate is. Honestly, it depends on audience size, industry, format and how warm your network is, and we do not publish benchmark figures without our own data behind them. Our guide What Is a Good Engagement Rate on LinkedIn? goes into why. The most useful yardstick is your own trend.
Here is how to build it. Start a simple spreadsheet with these columns and fill one row per post:
| Date | Topic | Hook type | Format | Impressions | Engagements | Comments | Rate by impressions |
|---|---|---|---|---|---|---|---|
| (date) | (one of your topics) | (story, list, question…) | (text, carousel, poll) |
After ten posts, sort by the rate column. Look at the top three and the bottom three, and note what the top ones have in common: a topic, a hook type, a format. That pattern is your first real finding, based on your audience rather than someone else’s. Then run your next round of posts with one change and add those rows too.
Review the sheet once a month, not every day. Single posts are noisy. Patterns over a month or two are what you can act on.